Live · markets open
Stoxly.ai - AI Stock Research & Portfolio Analytics Platform
Research any stock in depth, track every position live, read AI-scored market news and chart fundamentals across companies - every professional tool in one command center.
Start free. Upgrade anytime. · Explore with sample data
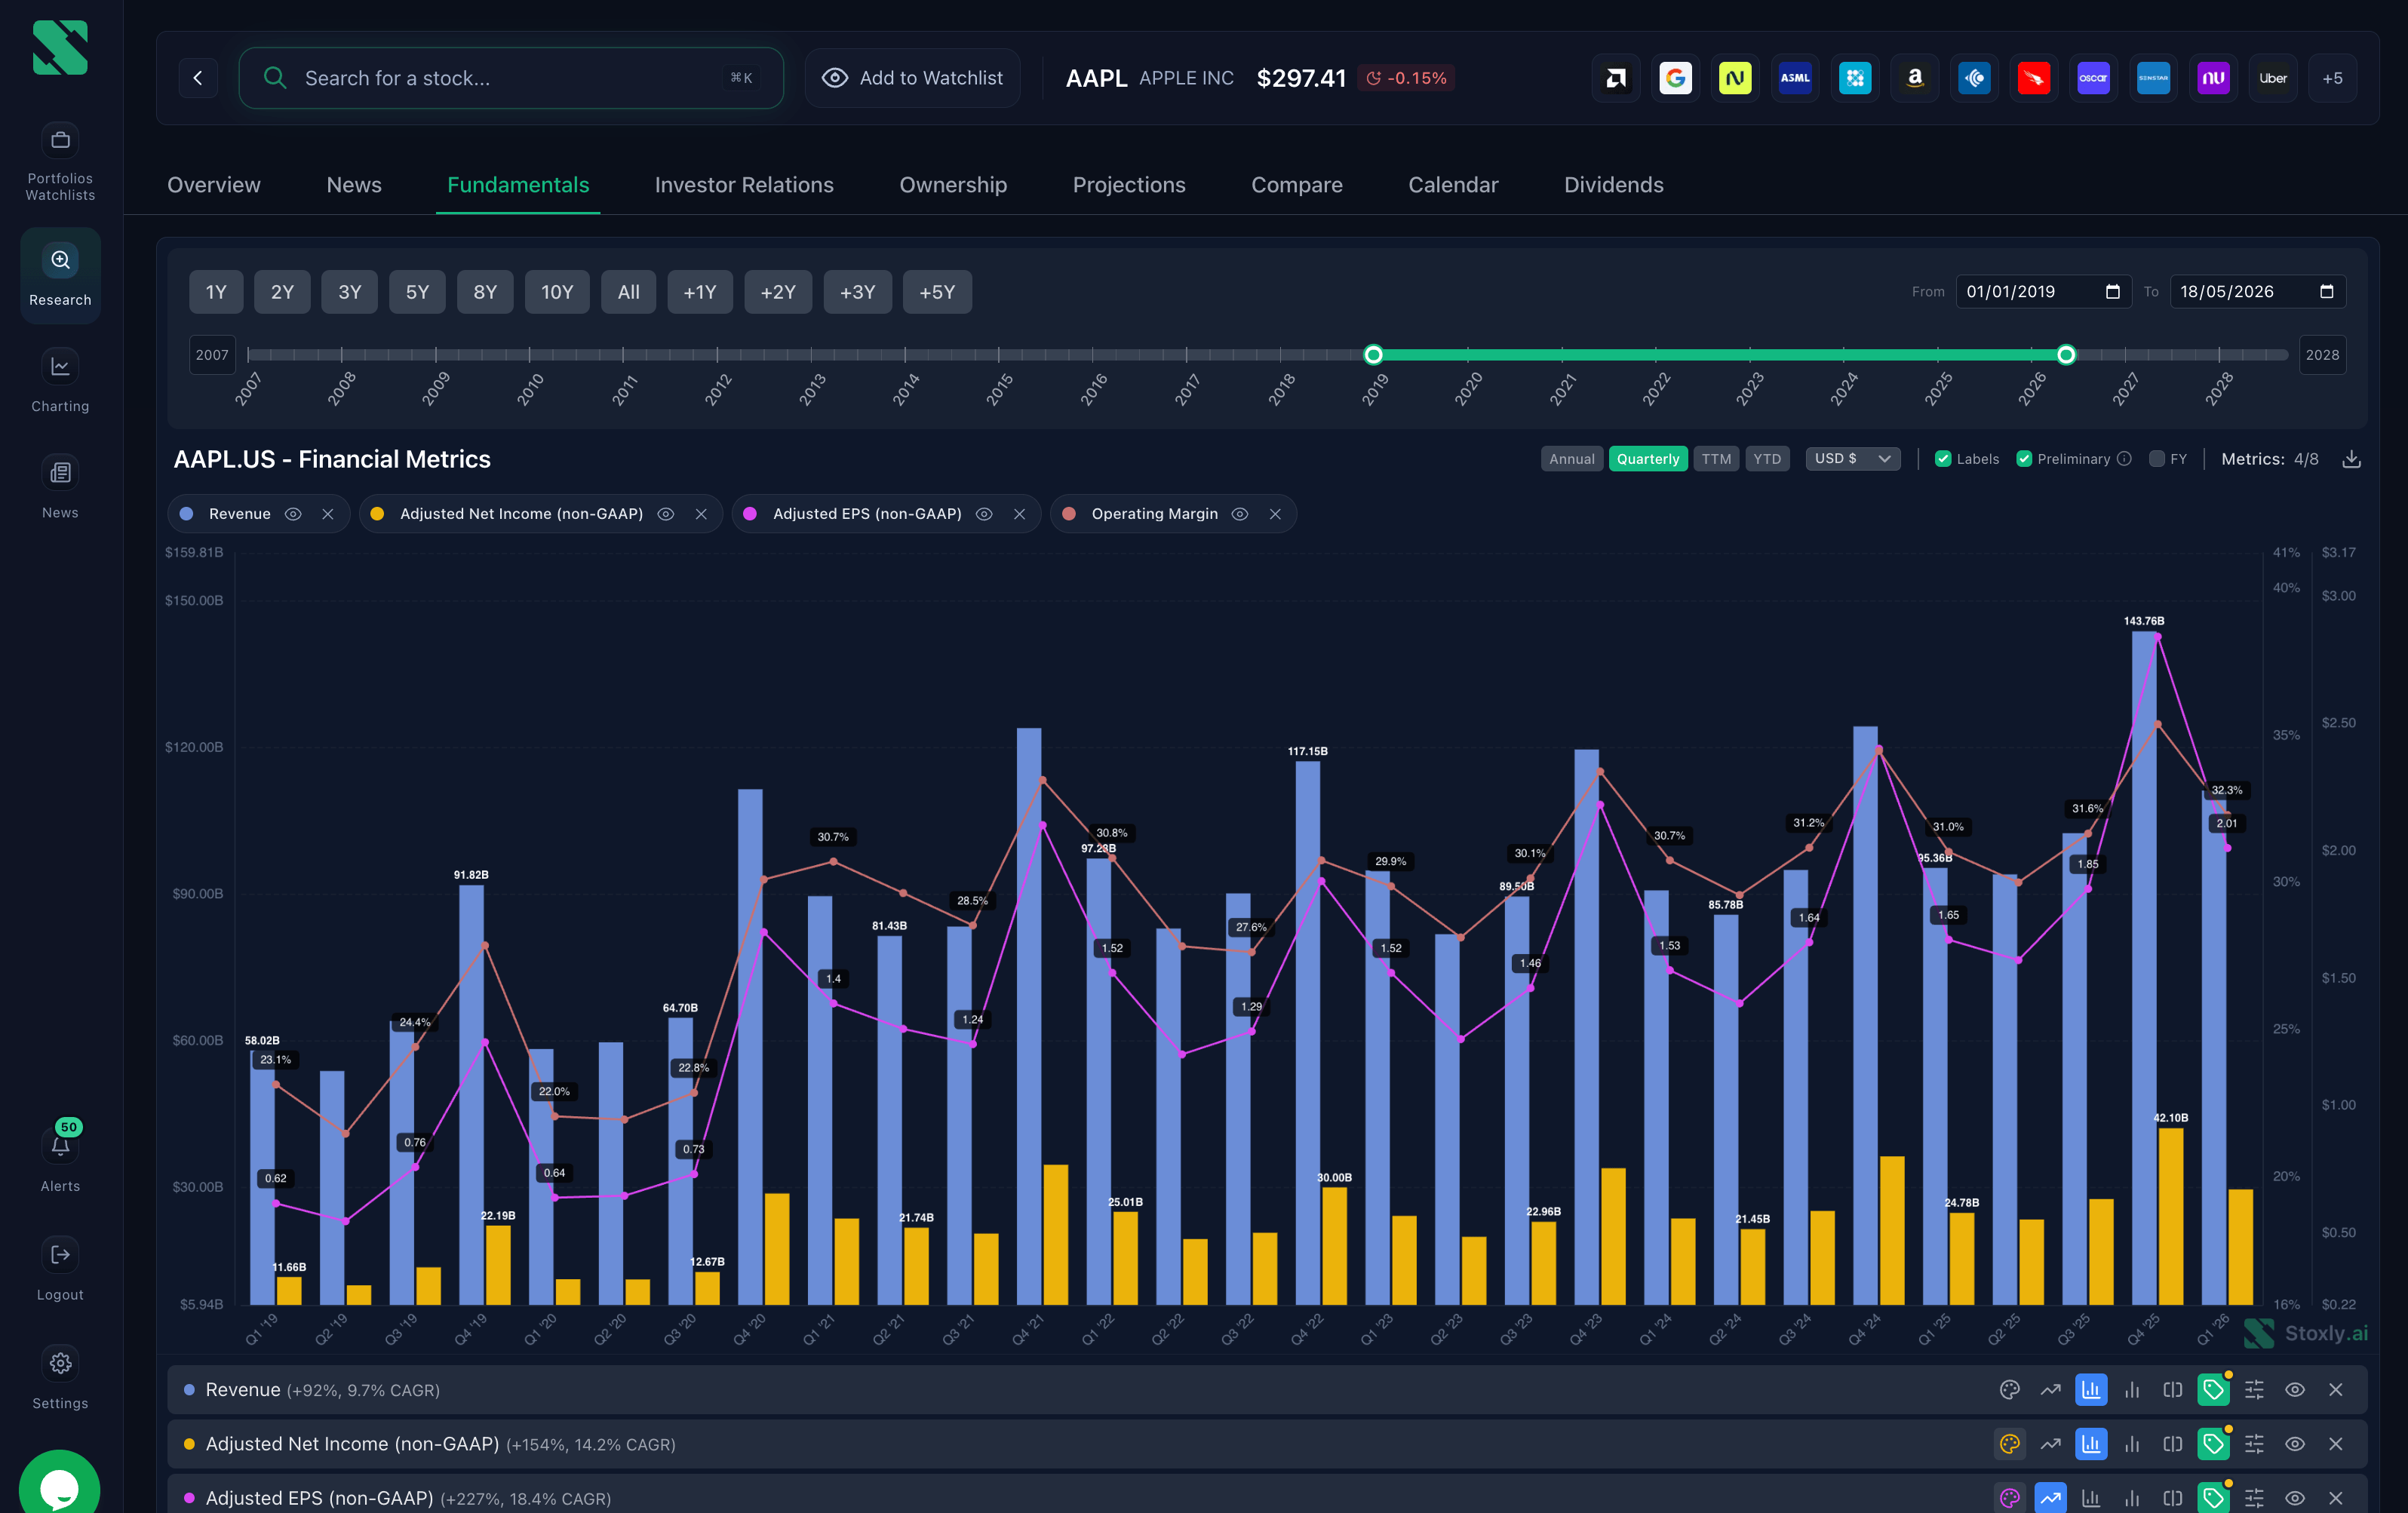
Stock research
Every metric. Every filing. Every angle.
Eight workspaces. One ticker. From quarterly fundamentals to insider activity, peer benchmarks, and AI-summarized earnings calls - without ever leaving the page.
Search for a stock...
AAPL APPLE INC · NASDAQ
$280.14 +2.34%
Overview
News
Fundamentals
Investor Relations
Ownership
Projections
Compare
Calendar
Dividends
Company Overview
Apple Inc. is an American multinational technology company headquartered in Cupertino, California, that designs, develops, and sells consumer electronics, computer software, and online services. It is considered one of the Big Four technology companies, alongside Amazon, Google, and Microsoft.
Show more Name Apple Inc
CEO Timothy Cook
Sector Technology
Year Founded 1980
Employees 166.00K
Website www.apple.com
EPS Surprises - AAPL
Actual Estimate 5Q
$1.12
$1.50
$2.00
$2.50
$3.18
Q2'25 Missed: $0.01
Q3'25 Beat: $0.11
Q4'25 Beat: $0.04
Q1'26 Beat: $0.11
Q2'26 Beat: $0.02
Company Statistics
Profile
Market Cap $4.39T
EV $4.46T
Shares Out 14.68B
Revenue $451.44B
Employees 166.0K
Valuation (TTM)
P/E 35.8
P/B 41.2
EV/Sales 9.9
EV/EBITDA 27.9
P/FCF 34.0
Growth (CAGR)
Rev 3Yr 1.8%
Rev 5Yr 8.7%
Rev 10Yr 5.9%
Dil EPS 3Yr 6.9%
Dil EPS 5Yr 17.9%
Latest Earnings Call AAPL - Earnings call Q2 2026 April 30, 2026
Price Chart
AAPL
$280.14 +$81.50 (+41.0%) past 1 year Download
$288
$264
$240
$216
$192
MayJunJulAugSepOctNovDecJanFebMarApr
Search for a stock...
AAPL APPLE INC · NASDAQ
$301.17 +0.99%
Overview
News
Fundamentals
Investor Relations
Ownership
Projections
Compare
Calendar
Dividends
AAPL Overview
Rank #1 of 15 Market Cap $4.31T
P/E Ratio 35.79
Revenue Growth 12.76%
Profit Margin 27.15%
Industry Peers Comparison
14 peersSymbol
Market Cap
P/E
Rev Growth TTM YoY
Margin
ROE
Rank
$4.31T
35.79
+12.76%
27.15%
146.69%
#1
$3.08T
23.88
+9.12%
39.90%
33.13%
#6
$1.55T
22.19
+26.18%
32.84%
33.22%
#4
$2.93T
32.00
+9.54%
11.98%
23.34%
#10
$20.74B
7.55
+4.36%
4.46%
16.85%
#13
$155.8B
13.85
+19.03%
1.89%
22.11%
#9
$100.06B
28.08
+8.02%
15.45%
35.23%
#8
$1.61T
433.02
+8.46%
4.83%
4.77%
#14
$231.37B
47.55
+82.76%
34.19%
42.33%
#2
MAIN MY INVESTMENT PORTFOLIO
$248,420 +2.34% today
Holdings
Transactions
Analytics
Fundamentals
Calendar
TODAY
+2.34% AI INSIGHT
Today 1W 1M
2 minutes ago
Read full analysis
NVDA +2.41% AMZN +1.18% MSFT +0.92% AAPL +0.78% TSLA -1.42%
Positions
Symbol
Quantity
Avg Cost
Current
Market Value
Gain / Loss
Weight
Actions
420.00
$94.20
$188.40 +2.41%
$79,128 Cost: $39,564
+$39,564 +100.0%
31.9%
92.00
$361.20
$447.05 +0.92%
$41,129 Cost: $33,230
+$7,899 +23.8%
16.6%
140.00
$176.40
$232.04 +0.78%
$32,486 Cost: $24,696
+$7,790 +31.5%
13.1%
130.00
$151.30
$214.60 +1.18%
$27,898 Cost: $19,669
+$8,229 +41.8%
11.2%
95.00
$388.12
$268.40 -1.42%
$25,498 Cost: $36,871
-$11,373 -30.8%
10.3%
Total (5)
$206,139
+$52,109 +33.8%
83.1%
MAIN MY INVESTMENT PORTFOLIO
$248,420 +2.34% today
Holdings
Transactions
Analytics
Fundamentals
Calendar
Start End
All types
Enter symbol
Min Max
Reset Export CSV Export PDF
Transactions
Date
Type
Symbol
Quantity
Price
Fees
Amount
P&L
Actions
May 12, 2026
Sell
25.00
$271.40
$1.20
+$6,783
-$2,918
May 8, 2026
Dividend
-
-
-
+$74.40
-
Apr 29, 2026
Buy
60.00
$171.20
$1.00
-$10,273
-
Apr 21, 2026
Buy
40.00
$198.60
$1.00
-$7,945
-
Apr 15, 2026
Sell
30.00
$228.10
$1.10
+$6,842
+$1,551
Apr 3, 2026
Dividend
-
-
-
+$33.60
-
Mar 26, 2026
Buy
22.00
$402.50
$1.00
-$8,856
-
Total bought $27,074 3 transactions
Total sold $13,625 2 transactions
Realized gain / loss -$1,367 Selected period
Total fees $5.30 7 transactions
All figures shown here are an illustrative mock - sign in for live data.
Charting
Compare companies, not just prices.
Plot revenue, margins, EPS and 150+ fundamentals for up to ten stocks on one chart - straight from SEC filings, in any currency, across any timeframe.
Search for a stock...
Charting
Select stocks to compare their fundamentals
Stocks
4/10 selected AAPL MSFT GOOGL NVDA Add stock
Popular groups Tech Giants Social Media EVs Banks Streaming
Save setup Clear all
Annual Quarterly TTM YTD
USD
Chart labels Fiscal labels Preliminary data Export
Timeframe From 2019-01-01 To 2026-05-16
1Y 3Y 5Y 10Y MAX
AAPL Revenue MSFT Revenue GOOGL Revenue NVDA Revenue
$391B $281B $348B $130B
20192020202120222023202420252026
Metrics 1/8 Revenue AAPL Line Bar 6.0% CAGR Revenue MSFT Line Bar 12.1% CAGR Revenue GOOGL Line Bar 11.5% CAGR Revenue NVDA Line Bar 41.8% CAGR
Search 150+ metrics...
Selected 4/8 Popular
10 Revenue
Net Income
Free Cash Flow
Income statement
22 Gross Profit
Operating Income
EBITDA
Balance sheet
19 Total Assets
Cash & Equiv.
Total Debt
Cash flow
14 Operating CF
CapEx
FCF Margin
Key metrics
21 Market Cap
ROE
Net Margin
Ratios
24 P/E
EV/EBITDA
P/S
Growth YoY
16 Revenue YoY
EPS YoY
EBITDA YoY
Growth QoQ
12 Revenue QoQ
EPS QoQ
Margin QoQ
All figures shown here are an illustrative mock - sign in to chart live data.
The Reality
Terminal-grade tools. Without the terminal price.
Your broker gives you the basics. Premium terminals charge $20,000+/year. Stoxly gives you everything you actually need - for free.
Portfolio & Tracking
Multi-wallet management
TWR performance tracking
Benchmark comparison
Allocation & risk analysis
Research & Data
100+ fundamental metrics
Full financial statements
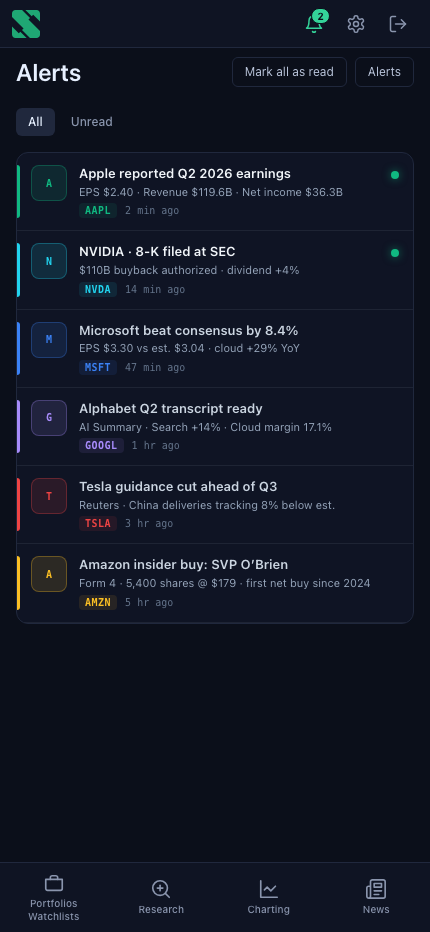
AI-powered smart news
AI-parsed SEC filings
Professional Data
Insider transactions
Congressional trades
Analyst projections & targets
Investor calendar
Advanced Tools
"What If" projections
Company comparison tool
Multi-broker aggregation
Price
$0
$20,000+/yr
From $0/mo
You don't need a new broker or an expensive terminal. You just need Stoxly.
The Stoxly Method
Introducing Stoxly.ai.
Make Smarter Decisions.
Every investment decision carries real weight. The difference between great and average investors isn't luck-it's process. We give you the tools to research deeper, track smarter, and exit at the right time. Data over emotions.
01
Research Deeper
Go beyond headlines. Explore 100+ fundamental metrics, read AI-parsed SEC filings, and build conviction before you put money on the line.
02
Track Smarter
See your entire portfolio in one view. Performance charts, sector allocation, smart news alerts-everything updated in real-time, across all your broker accounts.
03
Exit with Confidence
The hardest decision isn't what to buy-it's when to sell. Set your assumptions, track them automatically, and know when your thesis changes before the crowd does.
Start Making Better Decisions
Free plan available. No credit card required.
Auto-Sync via API
Connect once, sync automatically. Your portfolio stays up-to-date.


Manual Import


Stop Guessing. Start Analyzing.
Don't let a basic interface hold back your investing. Upgrade your experience with the professional dashboard you deserve and see the full picture.
Sign Up FreeSign up in 30 seconds. Get 100% free access while we're in our launch phase.
Pricing
Simple, Transparent Pricing
Start free, upgrade when you need more. No hidden fees.
Monthly Yearly Save 20%
Basic
Free
Everything you need to track your portfolio performance
- Unlimited portfolios
- Unlimited holdings
- Simple return, TWR, MWR performance
- Benchmark comparison (SPY, QQQ, IWM)
- + 6 more features
Premium Most Popular
$7.99 /mo
Billed $95.88/year
Deep insights with fundamentals, AI news, and ownership data
- Realtime market prices
- Complete fundamentals (100+ metrics)
- Investor Calendar
- Full access to Wall Street analyst forecasts
- + 9 more features
Ultimate Power User
$15.99 /mo
Billed $191.88/year
Maximum AI power with unlimited summaries and analysis
- Everything in Premium, plus:
- AI Powered News Dashboard (20 tickers)
- Unlimited IR Transcripts summaries
- AI Stock Daily Summary
- AI powered stock peer analysis
- + 2 more features